This research is a preliminary step for an upcoming project. Its focus is to describe the state of the art of Informal Transport Mapping in Sub-Saharan Africa.
Informal Transports are defined, by literature, as:
“Paratransit-type services provided without official sanction.”
R. Cervero, A. Golub, Informal Transport: A global perspective
In most of the sub-Saharan African cities, where this kind of service exists, there isn’t an official mapping of the buses lines and stops. However, there are few projects where communities of users or researchers tried to map Informal Transports within a city.
To find these examples, we started using “Informal Transport Mapping” as query for a Google search and then focusing only on visual representations, such as transit maps. One of the results is the following.
This map shows all the local names that informal transports have in African countries. We reframed the Google query combining each local name with “mapping.” This led us to grassroots projects, initiated by informal transports users or local communities in need of proper information on this kind of services.
The following are some examples of visual maps found, other projects can be found here.
Digital Matatus
Authors: Columbia University, MIT, University of Nairobi, Groupshot
Location: Nairobi, Kenya
Year: 2012
Status: Ongoing
Map Type: Topological
Format: PDF
Project Description
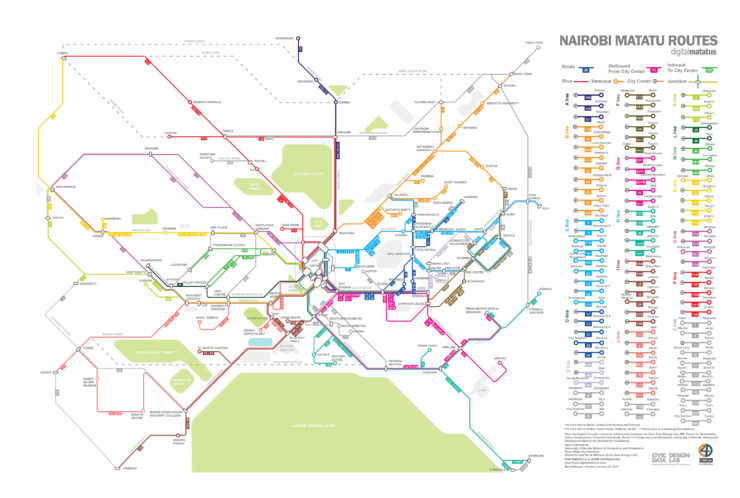
Digital Matatus is a collaboration between Kenyan and American universities. The project takes advantage of mobile phone technology to collect data about Matatus infrastructures.
Students from Nairobi University collected data about routes by using a GPS app, then stops were identified thanks to students and commuters experience and thanks to visual notation, such as signs.
The data needed to be cleaned and formatted into GTFS, this led to the creation of a new and more flexible GTFS standard for paratransit transports since calendars, timetables and fares are not available for Matatus. Google agreed to update the GTFS file format in use and implemented the data collected during this project as a test to display informal transports on Google Maps.
Map Description
Digital Matatus map is a topological map which wants to show a schematic diagram of Matatus routes. The routes are grouped in coloured lines according to their destination. Landmarks and significative points of Nairobi are highlighted on the map. The map is combined with a list of all Matatu stations and every Matatu line that stops in a specific station.
The map is only available for print, but web and app versions are being developed.
Minibus taxi Routes
Authors: WhereIsMyTransport
Location: Cape Town, South Africa
Year: 2017
Status: Completed
Map Type: Topological, Thematic
Format: PDF, Web
Project Description
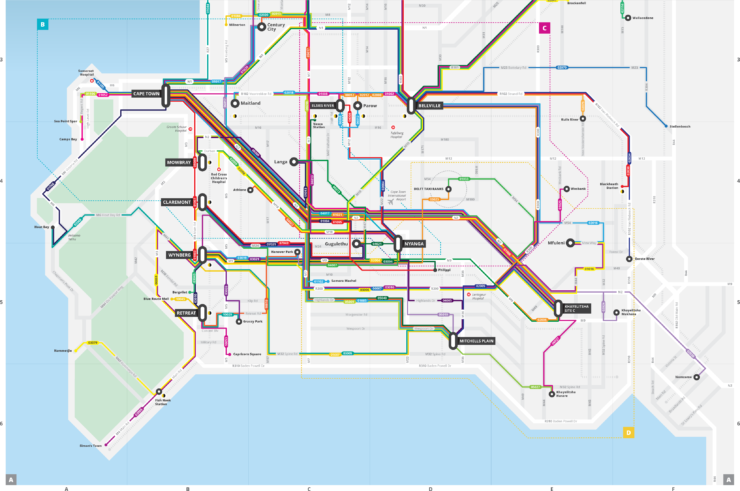
WhereIsMyTransport is a South African public transport data and technology startup. In 2017 they launched Cape Town Taxi Project: in three weeks they collected data about every route, common stopping point, frequencies and fares of minibusses with their own technology.
By integrating formal transport data with informal transport data, WhereIsMyTransport aims to map all the transit infrastructures of Cape Town. All the data are available from their own API for everyone to implement transport app or to design maps.
WhereIsMyTransport designed a printable map with the data collected.
Map Description
The WhereIsMyTransport printable map is a topological map which shows a schematic diagram of Minibusses routes and stops combined with formal transports stops. Each route has a number and a colour, but this marker is not used in the actual transport network. It’s not clear if lines with the same colour are related somehow. The map is divided into four tables. Table A shows the most active minibus routes, tables B C D show minibus routes of different areas.
WhereIsMyTransport API shows formal and informal transports stops on a map provided by Mapbox. All the other data are available as JSON file.
The Bus Map Project
Authors: Chadi Faraj, Jad Baaklini
Location: Beirut, Lebanon
Year: 2015
Status: Ongoing
Map Type: Topological, Thematic
Format: PDF, Web
Project Description
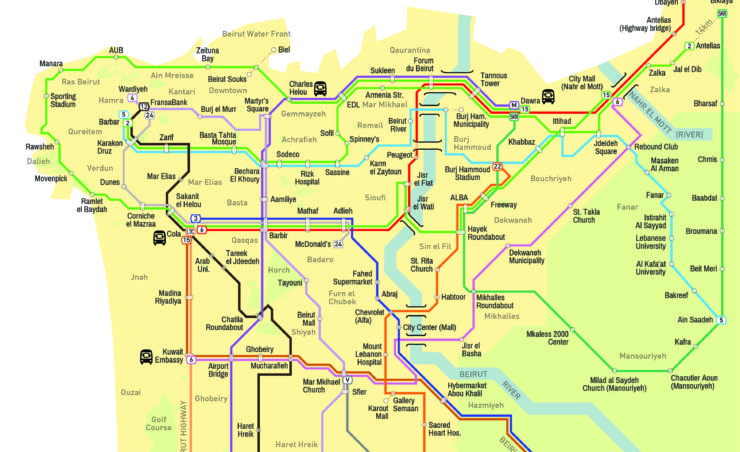
The Bus Map project is a grassroots initiative, started by Chadi Faraj and Jad Baaklini, which aims to map Lebanon formal and informal transport infrastructures. The data used to design the map were collected by ordinary citizens: the ultimate aim of this project is to create a community around the idea of collective mapping. This community should be able to keep the map up to date and to involve more and more people in this activity.
To collect the data app like Open GPS, Gaia GPS and Trails were employed, then the data are exported as GPX, KML and KMZ files and implemented in the map.
Map Description
The Bus Map project implemented two kinds of maps. The web-based one is a thematic map of the city of Beirut showing the bus lines: every line has its own colour and number. The bus stops are not visible on this map, the timetables are not available since the busses are not running regularly, landmarks of Beirut are highlighted. For each bus line is available information about such as the fare, the duration and the distance of the whole journey. The printable map is a topological map showing a schematic diagram of the bus lines, bus stops are included as well. Each bus line has its own colour and a number or name. On the map, there are instructions on how to use informal transports.
The Chapas Project
Authors: Joaquín Romero de Tejada
Location: Maputo, Mozambique
Year: 2013
Status: Ongoing
Map Type: Topological
Format: PDF
Project Description
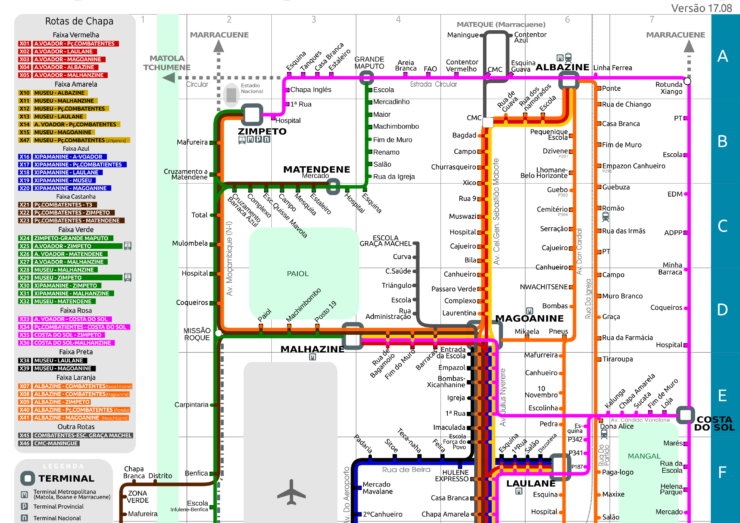
The Chapas Project was started in 2013 by Joaquín Romero de Tejada with the purpose of mapping informal transport infrastructures in Maputo. The data has been collected during fieldwork and is not available to be downloaded. Every year, since 2016, the map is updated.
Map Description
The Chapas Project map is a topological map showing a schematic diagram of the informal transport infrastructures. The bus lines are grouped by colour according to their starting point or route. Bus stops are highlighted and listed, with coordinates and other information.
Candongueiros de Luanda
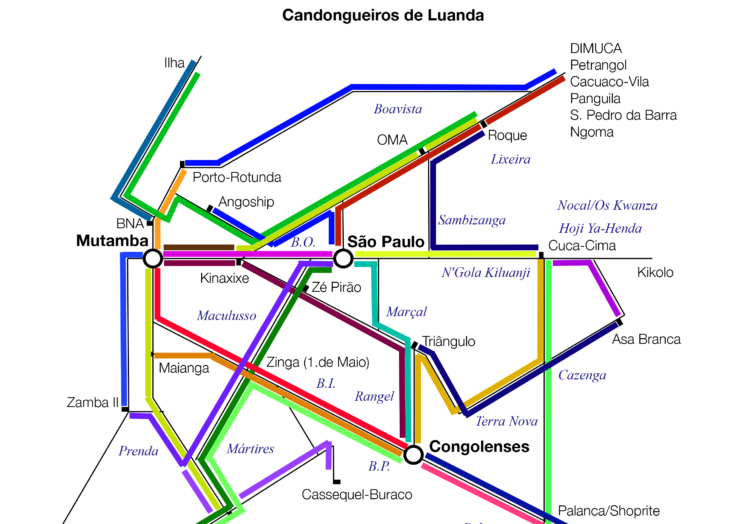
Authors: Development Workshop, Jon Schubert
Location: Luanda, Angola
Year: 2011
Status: Completed
Map Type: Topological
Format: PNG
Project Description
Candongueiros de Luanda is the outcome of a Development Workshop program in 2011. There isn’t any information on how data was collected, it is not available as well.
Map Description
Candongueiros de Luanda map is a topological map showing a schematic diagram of buses routes. Every bus has its own colour. There isn’t any bus stop or Luanda landmark on the map.
Dar es Salaam Dala Dalas mapping
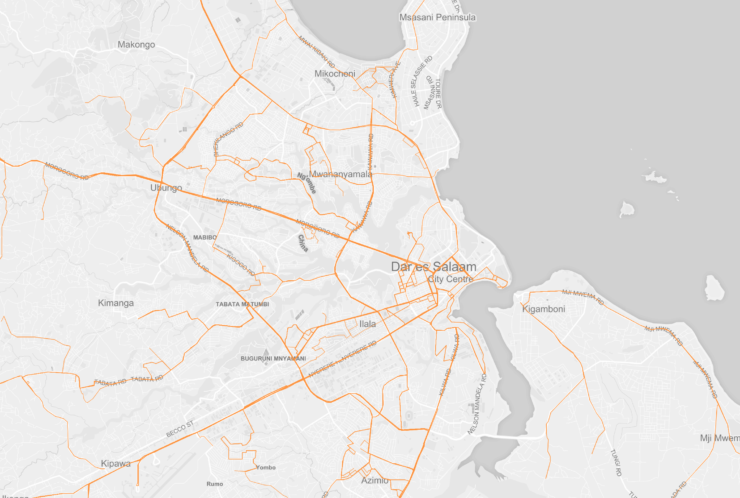
Authors: Dar Ramani Huria, Ally
Location: Dar es Salaam, Tanzania
Year: 2016
Status: Ongoing
Map Type: Thematic
Format: Web
Project Description
Mapping Dala Dalas in Dar es Salaam is a collaboration between Dar Ramani Huria and Ally. This initiative aims to collect information on the informal transports infrastructures and layer them with data already collected by Dar Ramani Huria on the seasonal floodings in the city. The data are collected by members of the community equipped with tools like OpenMapKit and OpenDataKit. The data are then processed by Dar Ramani Huria and uploaded on OpenStreetMap. Ally helped to format the data on informal transport infrastructures. The data are available on the Dar Ramani Huria website and on OpenStreetMap.
Map Description
There are three demo maps on the Ally website. Each map is based on the same Dar es Salaam thematic map and is showing different information. Two of these maps are showing Dala Dalas routes: the routes are all of the same colour, the information given is which are the most travelled streets by buses. One of these maps is static, the other one is animated, displaying Dala Dalas routes in an unclear sequence. The third map shows the bus stops, for each of them is not specified which bus line stops there.
Transports au Mali
Authors: JungleBus, OpenStreetMap community of Mali
Location: Bamako, Mali
Year: 2017
Status: Ongoing
Map Type: Thematic
Format: Web
Project Description
This mapping initiative was started by the JungleBus founder and the OpenStreetMap community of Mali. The project aims to map as much as possible Sotrama routes to give Bamako population better information on the informal transport infrastructures. The wiki doesn’t describe how the data is collected. It can be assumed that the data collection is a grassroots collection done by OpenStreetMap users who then update the website. The data are available to be downloaded from OpenStreetMap.
Map Description
The map is a thematic map: Dala Dalas routes and stops are displayed on Bamako city map. The bus lines have different colours and names. It is not clear whether different bus lines have been grouped under the same colour and name according to some variables. Two different kinds of stops are displayed: bus stops and taxi stops.
AccraMobile3
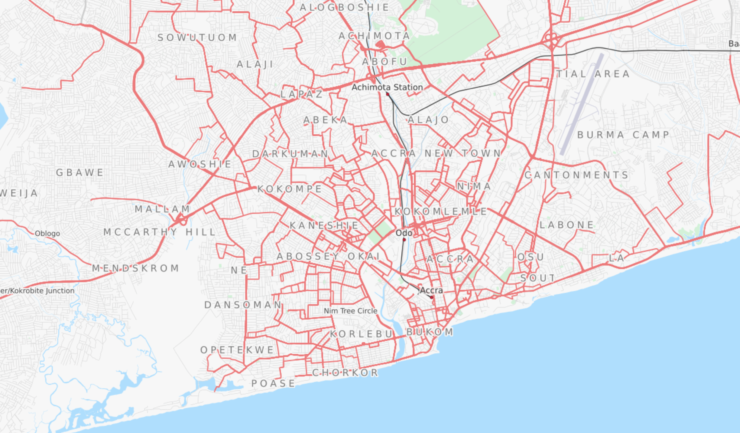
Authors: Accra Metropolitan Assembly, JungleBus, Agence Française du Développement, Transitec and OpenStreetMap community of Ghana.
Location: Accra, Ghana
Year: 2017
Status: Completed
Map Type: Thematic
Format: Web
Project Description
AccraMobile3 was an initiative that involved Accra Metropolitan Assembly, JungleBus, Agence Française du Développement, Transitec and OpenStreetMap community of Ghana. The collaboration lasted from July until September 2017, but it is continued by the OpenStreetMap community. The project aims to map all the routes of informal transport infrastructures in Accra. It is not described how the data are collected, but on the wiki of the project, there are instructions on how to format the data before uploading it on OpenStreetMap. All the data are accessible from the OpenStreetMap website.
Map Description
AccraMobile3 map is a thematic map of the city of Accra. On the map, all the Trotro lines are displayed at once and with the same colour. By selecting a specific route on the right panel, that bus line and its stops are highlighted in a different colour. There aren’t any markers or name to distinguish routes and bus stops.
Technologies used to display data
The data obtained during these projects are mostly displayed in printable transit maps. But some projects keep data also in digital form so that it’s easier to keep the maps updated. None of the projects described has a mobile phone functioning app.
- OpenStreetMap is a collaborative project to create a map of the world. Anyone can edit a map on OpenStreetMap and it is completely open source. However, the primary output of this project is the data that generates.
- Google Maps is a web mapping service developed by Google. The maps are not editable by users since Google is using copyrighted map data for Google Maps. To embed Google Maps in an external website, they launched Google Maps API. With this service is possible to add different layers from the ones provided by Google.
Both map services have been used in two different ways. Some projects only display the data they have, combining these map services with other tools. Other projects store the data using these map services and keep everything updated with them.
Other tools are
- MapBox is a provider of custom online maps for websites and applications. Their data sources are OpenStreetMap and NASA.
- OpenLayers is an open source JavaScript library for displaying map data. It provides an API for building rich web-based geographic applications.
Moreover there are also consortia of geo-data related tools. None of the projects above involved them, but we found them during the research:
- Open Source Geospatial Foundation is a non-profit and non-governmental organisation whose mission is to support and promote the collaborative development of open geospatial technologies and data.
- Open Geospatial Consortium is an international not for profit organization committed to making quality open standards for the global geospatial community. These standards are made through a consensus process and are freely available for anyone to use to improve sharing of the world’s geospatial data.
Technologies used to collect data
Most of the projects described used GPS Mobile Apps to collect information about informal transports. In projects were grassroots users or large communities are involved, it is not specified how the data is collected.
- OpenMapKit is an extension of OpenDataKit. It allows users to create mobile data collection surveys for field data collection.ODK tools allow everyone to create offline mobile surveys to collect field data. The data are then uploaded to a server when the mobile phone is online again. OMK extension is an android mobile application for browsing OpenStreetMap features to create and edit OSM tags.
- Open GPS Tracker is a small device which can be plugged into a prepaid mobile phone to make it a GPS tracker. The Tracker responds to text message commands, detects motion, and sends you its exact position. The tracker outputs a file for Google Maps or any mapping software. The Tracker firmware is open source and user-customizable.
- Gaia GPS and Trails are hiking apps. One of their function is to record the hiking trails and trips that a user follow.
Vocabulary
GTFS: General Transit Feed Specification, defines a common format for public transportation schedules and associated geographic information.s
Thematic Map: a type of map that focuses on a specific theme or subject area. These kinds of maps stress spatial variation of one or a small number of geographic distributions. source
Topological Map: a type of diagram that has been simplified so that only vital information remains and unnecessary detail has been removed. These maps lack scale, and distance and direction are subject to change and variation, but the relationship between points is maintained.


